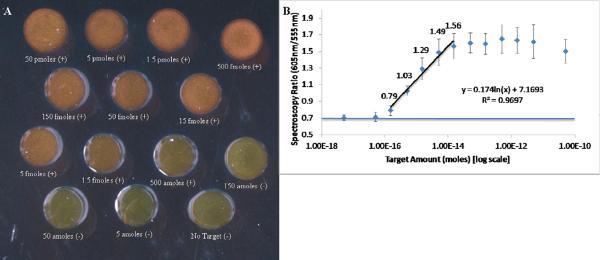
Figure 2.
A) Photograph of one run of the aggregation assay using `standard' reaction conditions. Each sample is marked with whether it would be considered positive (aggregated) or negative (monodispersed) by visual inspection. B) Averaged peak spectroscopy ratios (n=5) as a function of target concentration. The spectroscopy ratio is the ration between the amount of scattered light recorded at 605nm and 555nm after each of these spectra have been normalized to their respective peak value. The spectroscopic ratios have been labeled for samples in the linear range of this assay. Note that the 150 amole sample can be determined to be positive by spectroscopy, but not by visual inspection. A horizontal line has been plotted on the graph to show the average red/green ratio of the no target control sample. Error bars represent 1 standard deviation.

