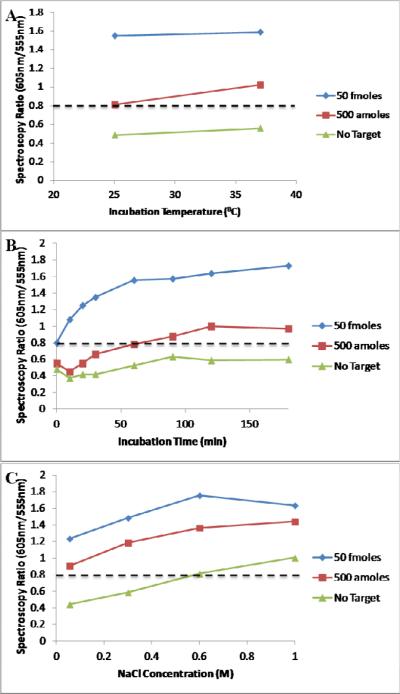
Figure 3.
A) The effect of incubation temperature on the spectroscopy results of the aggregation assay. B) The effect of different incubation durations. C) The effect of the salt concentration of the reaction buffer. A dashed line has been drawn for the red/green ratio = 0.8 above which spectral data was considered positive.

