Figure 5.
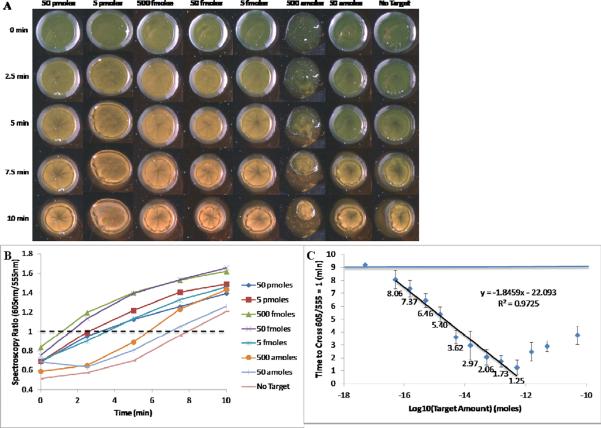
A) Visual results of monitoring aggregation kinetics on the side-illumination system, using oil coverings to prevent sample drying. B) Spectroscopy ratios calculated as a function of time. A dashed line has been drawn at 605nm/555nm = 1 and the time each sample took to cross this threshold was calculated. C) The average of 5 samples of the kinetics experiment on the side-illumination system. Error bars represent 1 standard deviation. A horizontal line has been plotted to show the average red/green ratio of the no target control samples. A linear fit line showing the relationship between the log10 of the target amount and the time to cross is shown. The spectroscopic ratios have been labeled for samples in the linear range of this assay.

