Fig. 1.
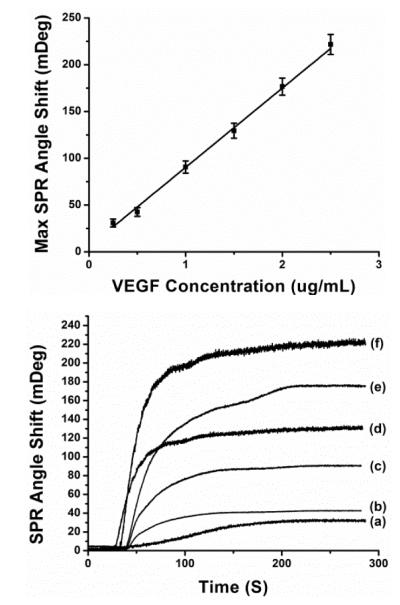
(A. upper figure) SPR sensor responses to VEGF sol ution at different concentration levels: (a) at 0.25 μg/mL, (b) at 0.5 μg/mL, (c) at 1 μg/mL, (d) at 1.5 μg/mL, (e) at 2 μg/mL and (f) at 2.5 μg/mL. (B. lower figure) Calibration curve: the linear relationship between change of SPR angle shift and VEGF concentration.

