
FIGURE 8.
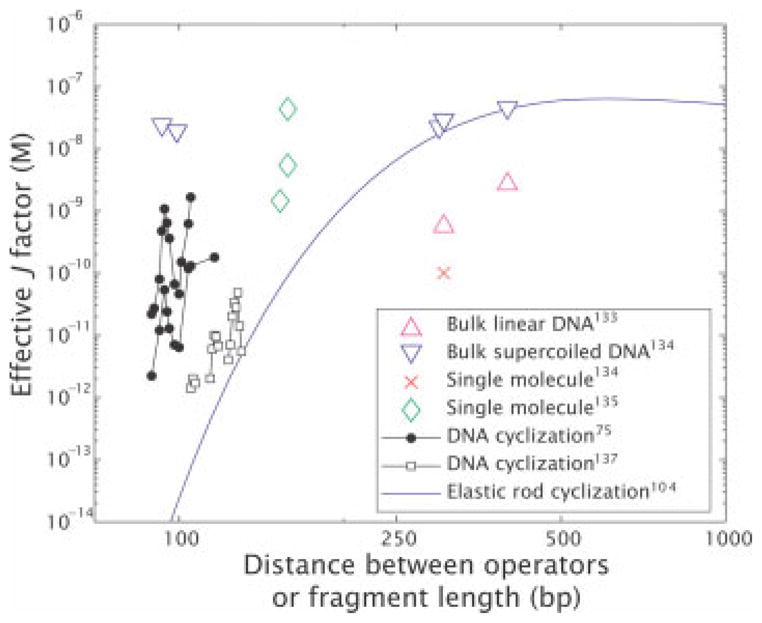
Effective J-factors for in vitro DNA looping. The graph is constructed by using a variety of different in vitro measurements to derive an effective looping J-factor, even in those cases where there was no direct measurement of J itself. The derived values were obtained from: (i) bulk linear DNA,133 (ii) bulk super-coiled DNA,134 (iii) single molecule measurements,135,136 (iv) DNA cyclization75,137 and the blue curve is a theoretical curve for cyclization corresponding to an extrapolation of the elastic rod model.104