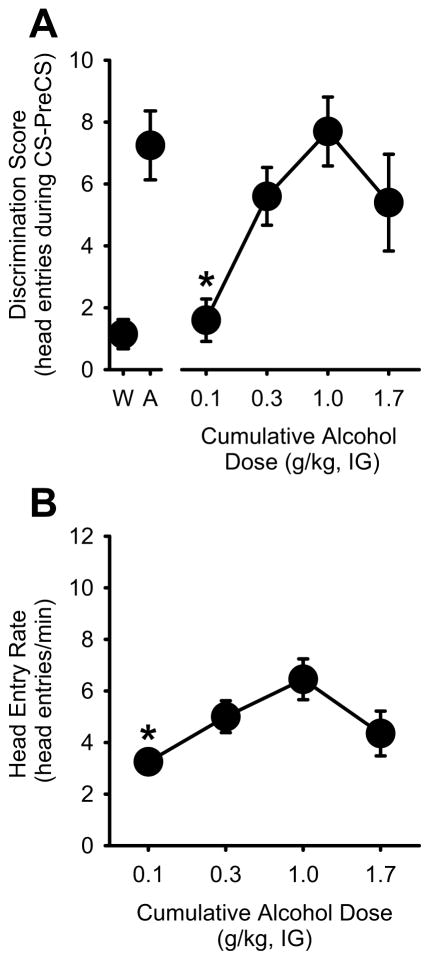
Figure 3. Alcohol substitution using Pavlovian procedures.
(A) Average (±S.E.M.) discrimination scores from the two alcohol and water sessions that preceded testing are represented at the left of axis break. Dose-dependent substitution for the 1 g/kg alcohol dose was observed, demonstrating that the training procedures established reliable control of goal-tracking behavior. (B) Mean (±S.E.M.) head entry rate (head entries/min) was significantly lower at the lowest alcohol dose (0.1 g/kg). * denotes significantly different from the 1 g/kg alcohol training dose (p<0.05).

