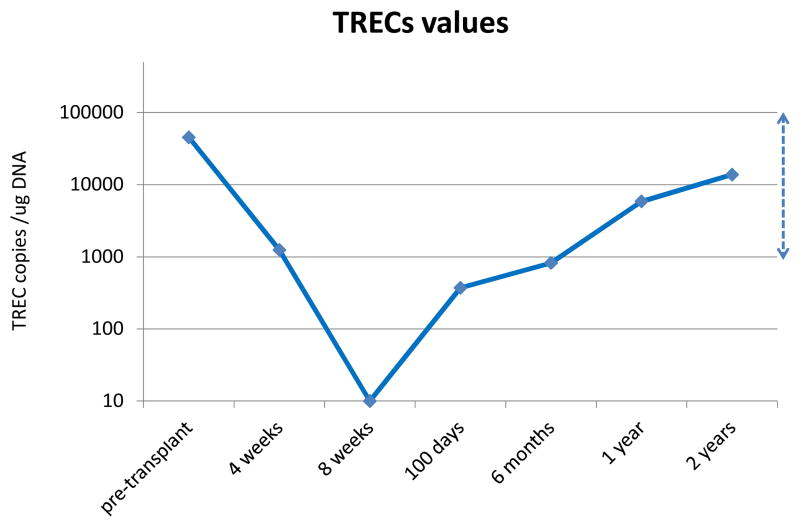
Figure 3.
T cell receptor excision circles (TREC) levels. TREC counts per microgram PBMC DNA were determined by quantitative PCR. The line connects the average values of the individual time points. The limit of detection of the TREC assay was 10 copies / ug DNA. The dashed line to the far right shows range of values for 10 normal controls of similar ages.

