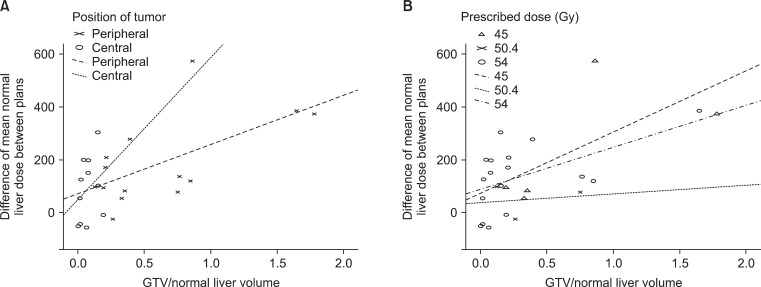
Fig. 2.
Correlation between the differences between the mean normal liver doses of two plans and gross tumor volume (GTV) to normal liver volume ratios. (A) Correlation with respect to tumor location. Pearson's correlation coefficient was 0.288 for central tumors (p = 0.390) and 0.609 for peripheral tumors (p = 0.021). (B) Correlation with respect to prescribed dose. Pearson's correlation coefficients were 0.662 at 45 Gy (p = 0.224), 0.163 at 50.4 Gy (p = 0.896) and 0.539 at 54 Gy (p = 0.026).

