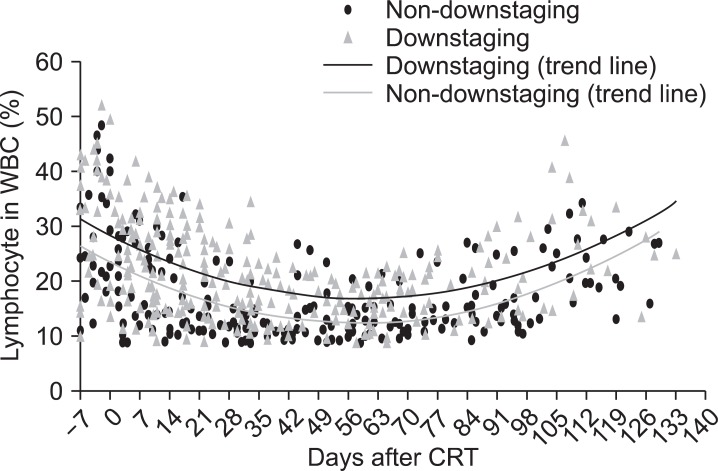
Fig. 1.
The change of relative lymphocyte count (%) during the period of treatment. The start of radiotherapy (RT) was set at day 0 and the values obtained at the day from the start of RT were plotted. The trend line represents a trend, the long-term movement in time series data. It tells whether a particular data set have increased or decreased over the period of time. CRT, chemoradiotherapy; WBC, white blood cell.

