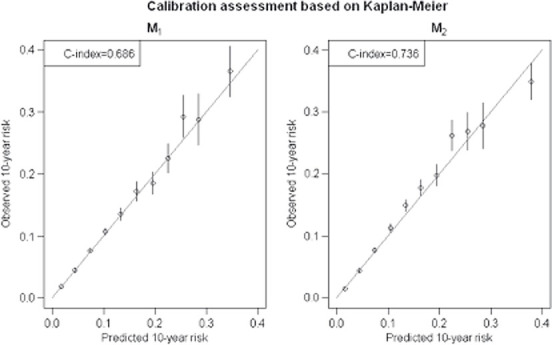
Figure 2.

Calibration plot with 95% CIs for observed (1-KM) against predicted risk (mean risk within each risk group). Risk groups are model-specific and increase by 3% from 0 to < 30% (the last group is ≥30%). Estimation of the C-index is based on comparing predicted 10-year risk with observed outcomes between all comparable pairs irrespective of study origin.
