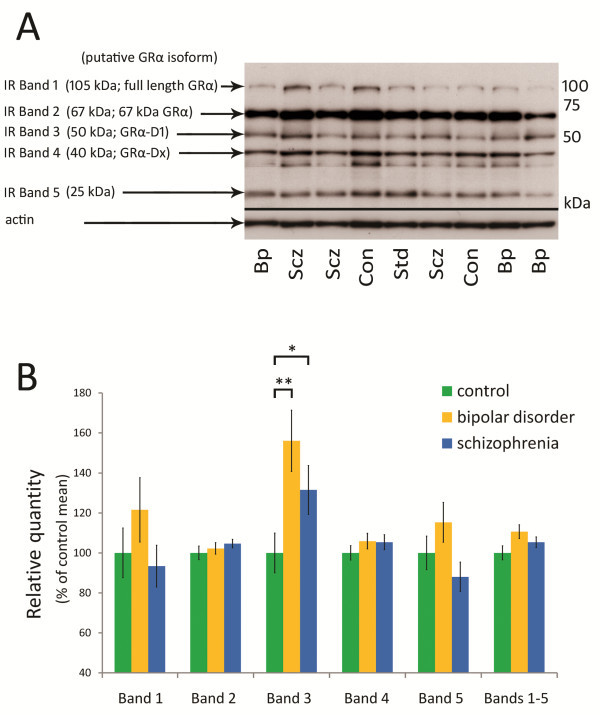
Figure 3.
Quantification of GRα protein in the OFC in controls, bipolar disorder cases and schizophrenia cases. A) Representative western blot of lateral OFC protein homogenate, revealing immunoreactive (IR) bands 1–5, approximately 105, 67, 50, 40 and 25 kDa in size. IR bands 1, 2, 3 and 4 are likely to represent full-length GRα, 67 kDa GRα, GRα-D1 and GRα-Dx respectively. B) Intensities of GRα IR bands in western blotting of lateral OFC samples. There were significant differences in intensities of IR band 3 [GRα-D1; ANOVA F(2, 97) = 4.15, p < 0.05] between schizophrenia cases, bipolar disorder cases and controls. A significant 56.1% increase in IR band 3 intensity of bipolar disorder cases relative to controls (p < 0.005), and a significant 31.5% increase in IR band 3 intensity of schizophrenia cases relative to controls (p < 0.05) were observed. Error bars represent SEM. Abbreviations: Bp- bipolar disorder, Scz- schizophrenia, Con- control.* p < 0.05, ** p < 0.005.

