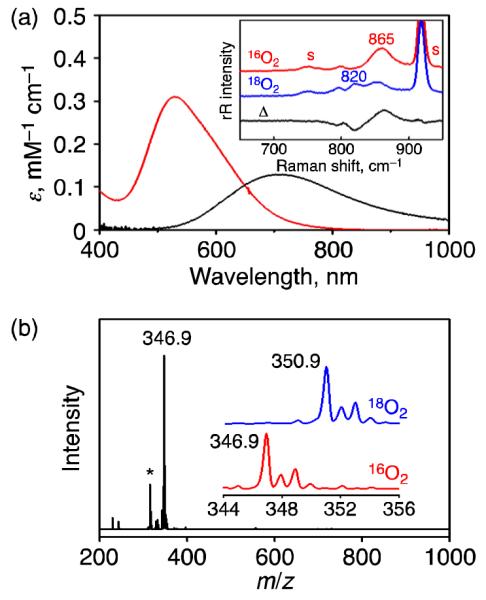
Figure 1.

(a) UV-vis spectra of 1 (black) and 2 (red) in CH3CN at 0 °C. Inset; rRaman spectra of 2 prepared with 16O2 (red) and 18O2 (blue) and the difference spectrum (black). (b) ESI-MS of 2. Inset; isotope distribution patterns for 2-16O (red) and 2-18O (blue). The peak at m/z = 315.3 with asterisk was assigned to [CrII(12-TMC)(Cl)]+ (calculated m/z of 315.1).
