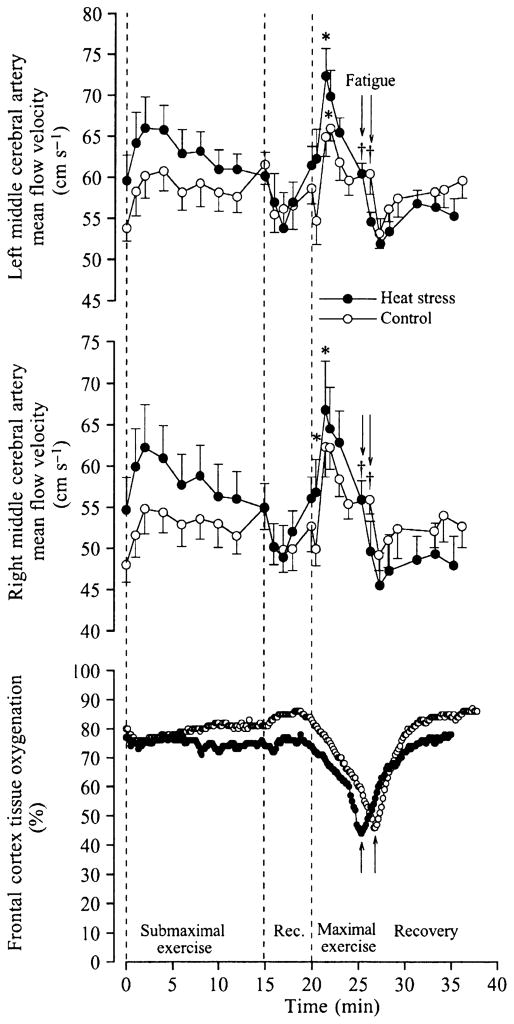
Figure 7.
Cerebral circulation and oxygenation during maximal whole-body exercise in heat-stressed humans. Left and right middle cerebral artery blood velocity and near-infrared spectroscopy-determined cerebral tissue oxygenation at rest, during submaximal and maximal cycling and during 10 min of recovery in heat stress and control conditions. Note the marked reductions in blood velocity accompanying the declines in tissue oxygenation. *Higher than value at start of exercise, P < 0.05. †Lower than peak value during maximal exercise, P < 0.05. From González-Alonso et al. (2004); republished with permission from Wiley-Blackwell.

