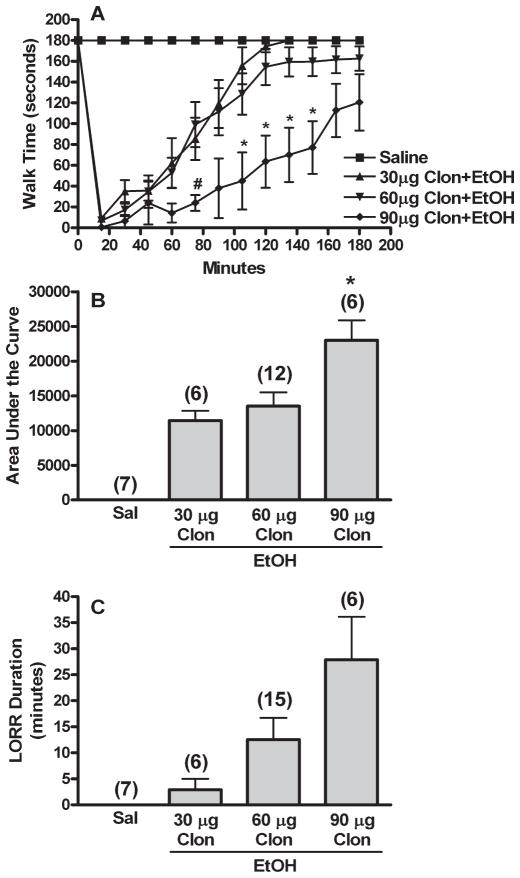
Fig. 2.
Clonidine causes dose-related enhancement of ethanol induced behavioral impairment. Rotorod time courses (A), corresponding area under the curve (AUC, B), and LORR durations (C) are shown for groups pretreated i.c. with aCSF prior to 2 i.v. injections of 30, 60, or 90 μg/kg clonidine (30, 60, or 90 μg Clon) followed by 1 g/kg ethanol (EtOH). Sal (Saline) and 60 μg Clon (Clonidine) groups are replotted from Fig. 1. The number of animals per group is shown in parentheses above the bar graphs. p < 0.05, *differs from 30 μg Clon (rotorod trends also differed); #differs from 60 μg Clon. LORR data did not reach significance due to unequal variance.

