Figure 1.
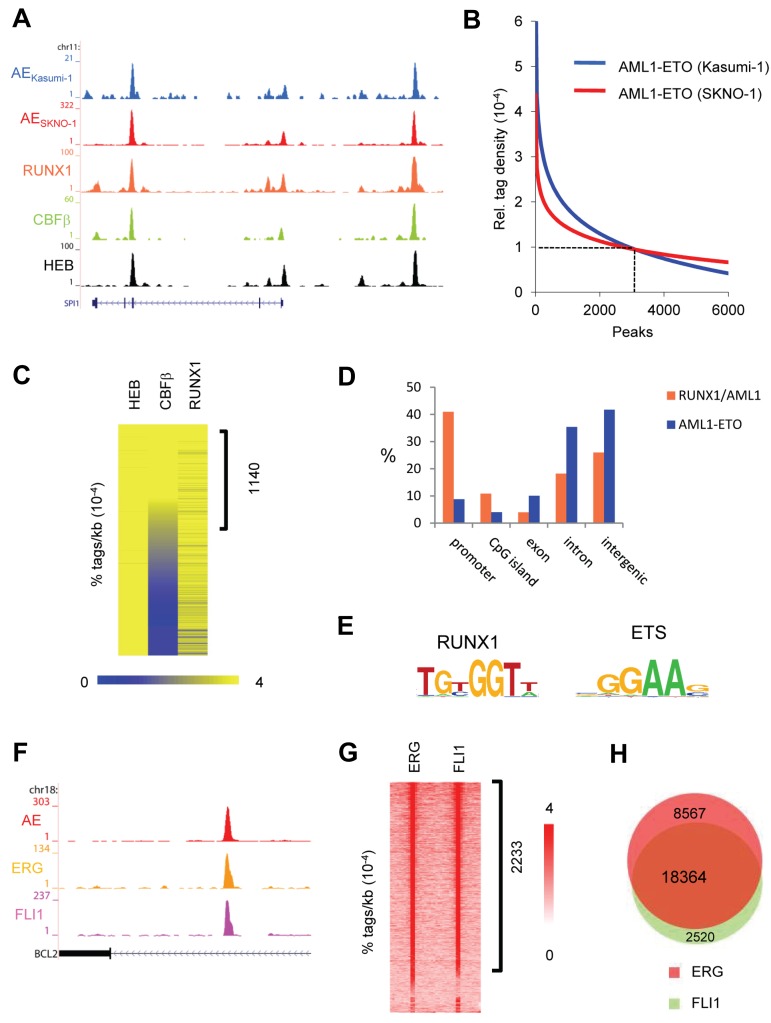
AML1-ETO and ETS factors bind similar genomic regions. (A) Overview of the SPI1 AML1-ETO binding site. Blue represents the Kasumi-1 AML1-ETO (AE) ChIP-seq data; red, the SKNO-1 AML1-ETO (AE) data; orange, the RUNX1 data; green, the CBF-β data; and black, the HEB data. (B) AML1-ETO binding sites detected by ChIP-seq in leukemic Kasumi-1 and SKNO-1 cells. AML1-ETO peaks were called using MACS (P = .00000001) after which relative AML1-ETO density in Kasumi-1 or SKNO-1 cells was determined at these peaks. Results were sorted according to relative tag density, and the top 6000 peaks displayed in a regression curve. A cut-off was set at a relative tag density of 0.0001 (14 tags/kb). (C) Heatmap displaying HEB, CBF-β, and RUNX1 tag densities at the 2754 high-confidence AML1-ETO binding sites. (D) Distribution of the AML1-ETO and RUNX1/AML1 binding site locations relative to RefSeq genes. Locations of binding sites are divided in promoter (− 500 bp to the transcription start site), nonpromoter CpG island, exon, intron, and intergenic (everything else). (E) Overview of the RUNX1 and ETS core binding motif. (F) Overview of the BCL2 AML1-ETO binding site in SKNO-1 cells. Red represents the AML1-ETO (AE) ChIP-seq data; orange, the ERG data; and pink, the FLI1 data. (G) Intensity plot displaying ERG and FLI1 tag densities at high-confidence AML1-ETO binding sites. (H) Venn diagram representing the overlap of ERG and FLI1 binding sites in SKNO-1 cells.

