Figure 1.

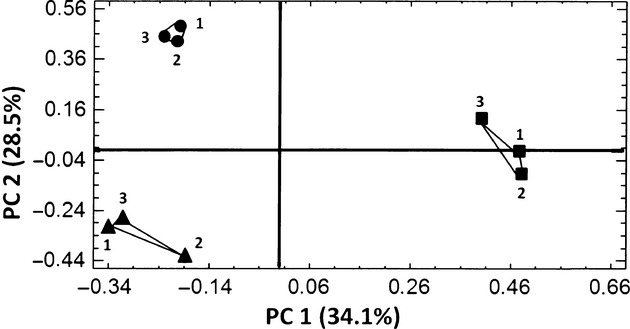
Principal component analyses (PCA) performed on normalized transcriptomic data. PCA revealed two main components: PC1 and PC2 corresponding to culture duration and growth mode, respectively. Planktonic exponentially growing PAO1 cells (PC4) are represented by squares (▪), planktonic PAO1 cells in stationary phase (PC24) are represented by circles (•), and sessile PAO1 cells (SC24) are represented by triangles (▴). The data corresponding to the three biological replicates (R1, R2, and R3) are indicated by the numbers 1, 2, and 3. Percentages indicate the importance of the PC1 and PC2 components in the variability of gene expression. The PCA results and 2D component plot were obtained using Statgraphic Plus 5.1 software.
