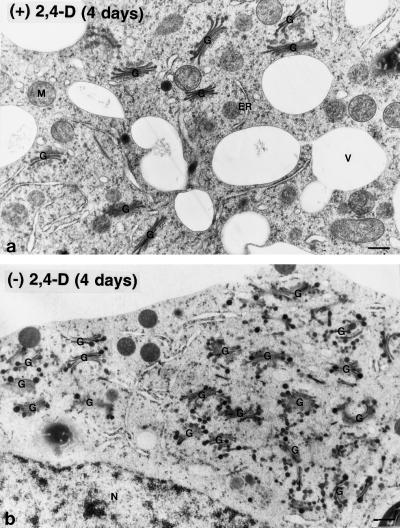
Figure 5.
Electron micrographs of Golgi stacks from control (a) and auxin-deprived (b) BY-2 cells. In the control cells the Golgi stacks had a uniform distribution throughout the cytoplasm. In the auxin-deprived cells the Golgi stacks clustered together near the nucleus. G, Golgi stacks; M, mitochondria; N, nucleus; and V, vacuole. Bars = 0.5 μm.

