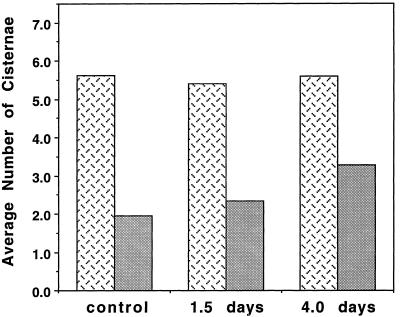
Figure 8.
Histogram illustrating the auxin-deprivation-induced increase in the number and proportion of trans-type cisternae (gray bars) in relation to the total number of cisternae (stippled bars). The total number of cisternae did not significantly change over time, but the average number of trans-type cisternae increased after 1.5 and 4 d of auxin deprivation.

