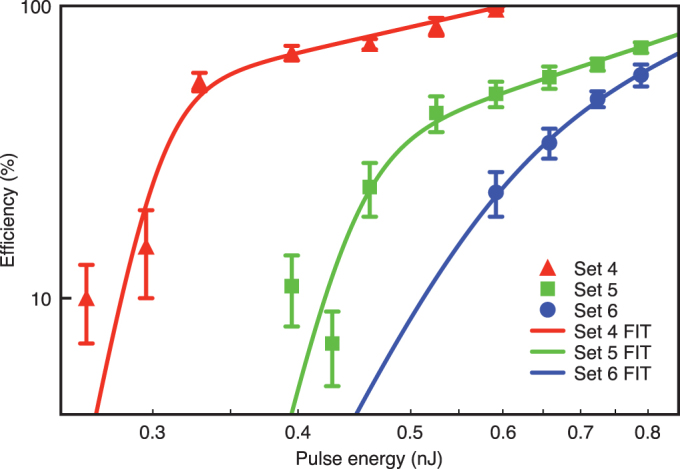
Figure 3. Membrane permeabilisation efficiency as function of pulse energy (Ep), with each data point represented by mean ± s.e.m.

The fits shown represent continuous functions whose gradients are equivalent to linear fits in the limit of either the lower or higher pulse energy regions. The point of inflection in each fit defines the transition value from high and low photon order.
