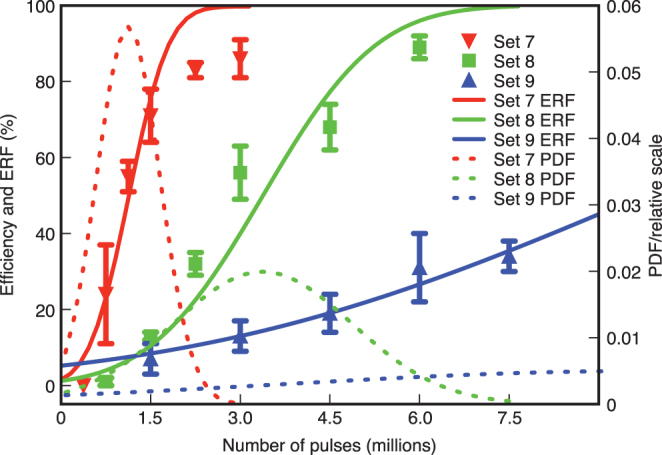
Figure 4. Membrane permeabilisation efficiency as function of number of pulses, with each data point represented by mean ± s.e.m.

The error function, ERF (solid line) represents the cumulative density function fitted to the data. The mean and standard deviation obtained from the ERF define the probability density function, corresponding to a normal distribution (PDF, dashed line).
