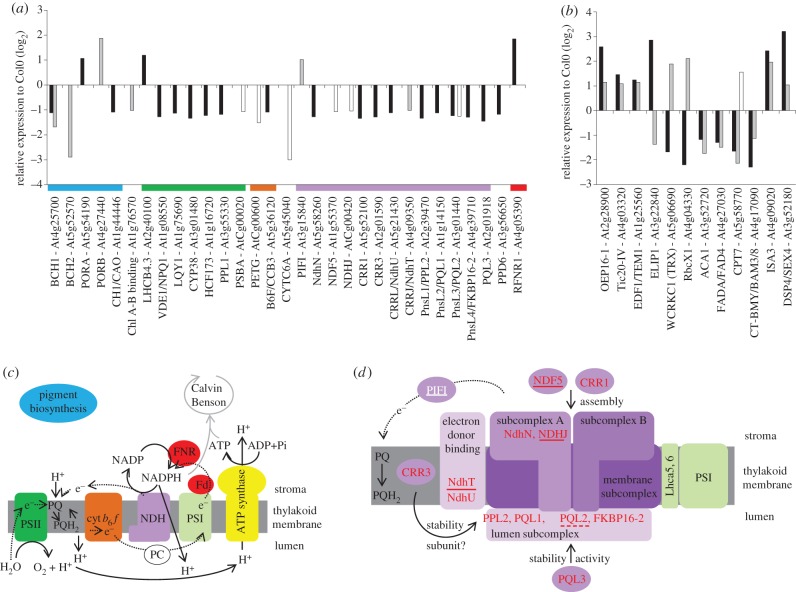
Figure 3.
The effects of ascorbate and glutathione on the abundance of transcripts encoding chloroplast proteins. (a) Transcripts encoding components of the photosynthetic electron transfer chain: the colour of the bar below each group indicates the location of the encoded protein as illustrated in diagram (c) or (d). (b) Transcripts encoding chloroplast-associated proteins in the vtc2 and rml1 mutants, respectively; for (a) and (b): black bars, low glutathione in rml1; grey bars, low ascorbate in vtc2; white bars, low ascorbate in vtc1. (c) Schematic of the photosynthetic electron transfer chain. (d) Schematic of the NDH complex indicating the localization of proteins encoded by genes identified in (a). The NDH subcomplexes and related proteins are highlighted in purple, the association with PSI is shown in green (white, induced genes; red, repressed genes; not underlined indicates responsive to low GSH; solid underline indicates responsive to low ascorbate; dashed underline indicates responsive to low GSH and low ascorbate).

