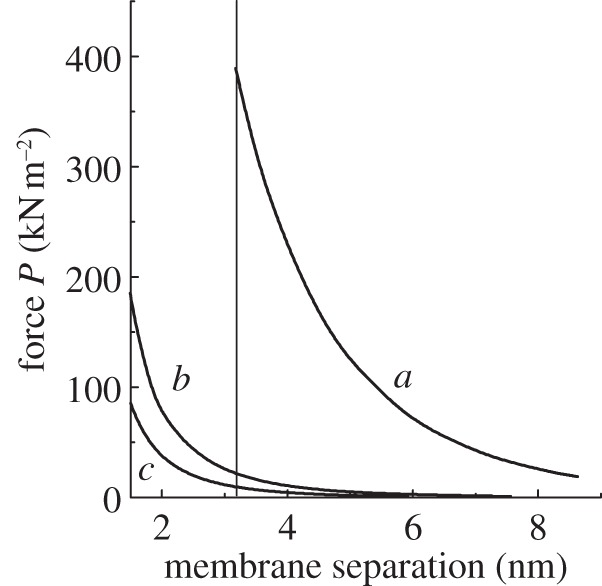
Figure 3.

Theoretical calculations of the contributions to the force per unit area, P, between two membranes as a function of separation, re-plotted on a linear scale from Rubin et al. [31]. The curve a represents the electrostatic repulsion in a stacking ionic medium (5 mM Mg2+ together with 10 mM K+), calculated at constant surface potential and σ = −25 mC m−2. Curves b and c (taken from fig. 3 of Sculley et al. [35]) denote the van der Waals attraction, corresponding to dielectric constants of 3 and 2.5, and volume fractions of protein in the membrane of 0.6 and 0.4, respectively. The vertical line indicates the membrane separation recently determined by Daum et al. [36].
