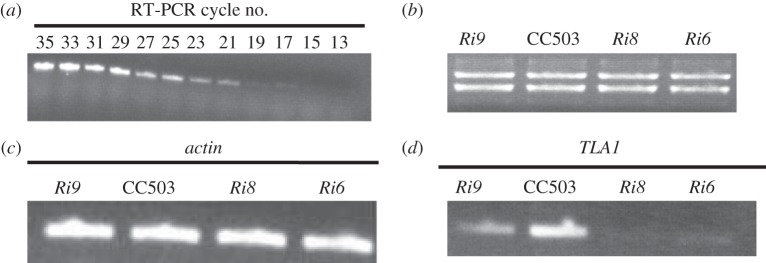
Figure 4.
(a–d) Transcript analysis in the TLA1 RNAi transformants and the wild-type CC503 strain. (a) Cycle RT-PCR analysis of the wild-type CC503 using RNA template. Primer 2 (TLA1 first exon-specific forward primer; table 3) and primer 6 (TLA1 second exon-specific reverse primer; table 3) were used in RT-PCR cycles ranging from 13 to 35. Cycle number 27 was selected for further semi-quantitative analysis of RT-PCR products obtained using Actin and TLA1-specific primers. (b) RNA agarose gel showing equal loading of total cell RNA from TLA1 RNAi transformants and the wild-type CC503. Three microgram of total cell RNA from the TLA1 RNAi transformants and WT strain were loaded on the gel. (c) Semi-quantitative RT-PCR product analysis using Actin-specific primers on cDNA template. Primer 3 and primer 7 (Actin gene-specific; table 3) were used for semi-quantitative RT-PCR analysis (cycle 27) of Actin transcripts (363 bp product) in the three TLA1 RNAi transformants (Ri6, Ri8 and Ri9) and the WT. (d) Semi-quantitative RT-PCR product analysis using TLA1-specific primers on cDNA template. Primer 2 (TLA1 first exon-specific forward primer; table 3) and primer 6 (TLA1 second exon-specific reverse primer; table 3) were used for semi-quantitative RT-PCR (cycle 27) analysis of TLA1 transcripts (359 bp product) in the three TLA1 RNAi transformants (Ri6, Ri8 and Ri9) and the WT. Note the diminished amounts of TLA1 transcripts in the RNAi transformants.

