
Figure 2.
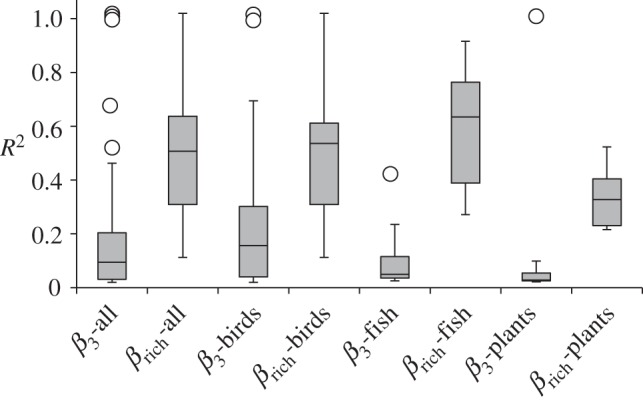
Box plot comparing the mean mantel R2 of Δβcc versus Δβ3 and Δβcc versus Δβrich for all taxonomic groups (all) and across taxonomic groups (birds, fish and plants).
Official websites use .gov
A
.gov website belongs to an official
government organization in the United States.
Secure .gov websites use HTTPS
A lock (
) or https:// means you've safely
connected to the .gov website. Share sensitive
information only on official, secure websites.
Box plot comparing the mean mantel R2 of Δβcc versus Δβ3 and Δβcc versus Δβrich for all taxonomic groups (all) and across taxonomic groups (birds, fish and plants).