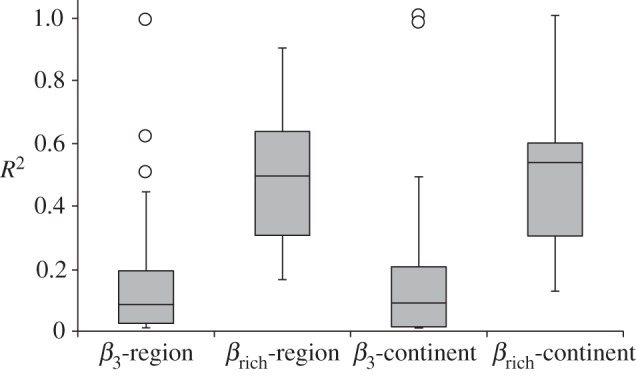
Figure 3.

Box plot comparing the mean mantel R2 of Δβcc versus Δβ3 and Δβcc versus Δβrich across spatial extent (continental and regional). Global spatial extent was not included because only two of the 50 datasets studied homogenization at this scale.
