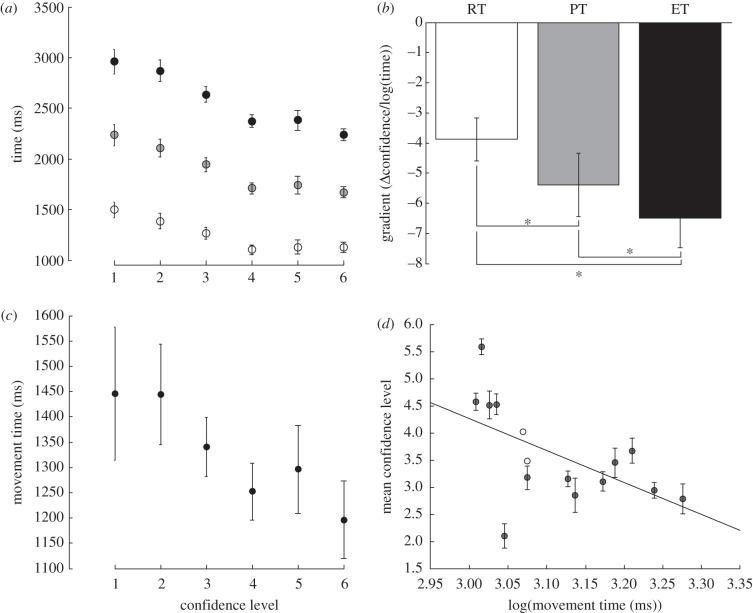
Figure 1.
Action execution. (a) The average time for three of the timing measures, RT (open circles), PT (grey circles) and ET (black circles) across subjects for the six confidence levels. (b) The mean gradient from the linear correlation of confidence level with the log-transformed timing data for RT (open circles), PT (grey circles) and ET (black circles) across subjects. Asterisk indicates significant differences at p < 0.05. (c) The mean movement time, MT, averaged across subjects for each confidence level. (d) The relationship between mean MT and mean confidence for each subject. In each panel, errorbars show s.e. of the mean.

