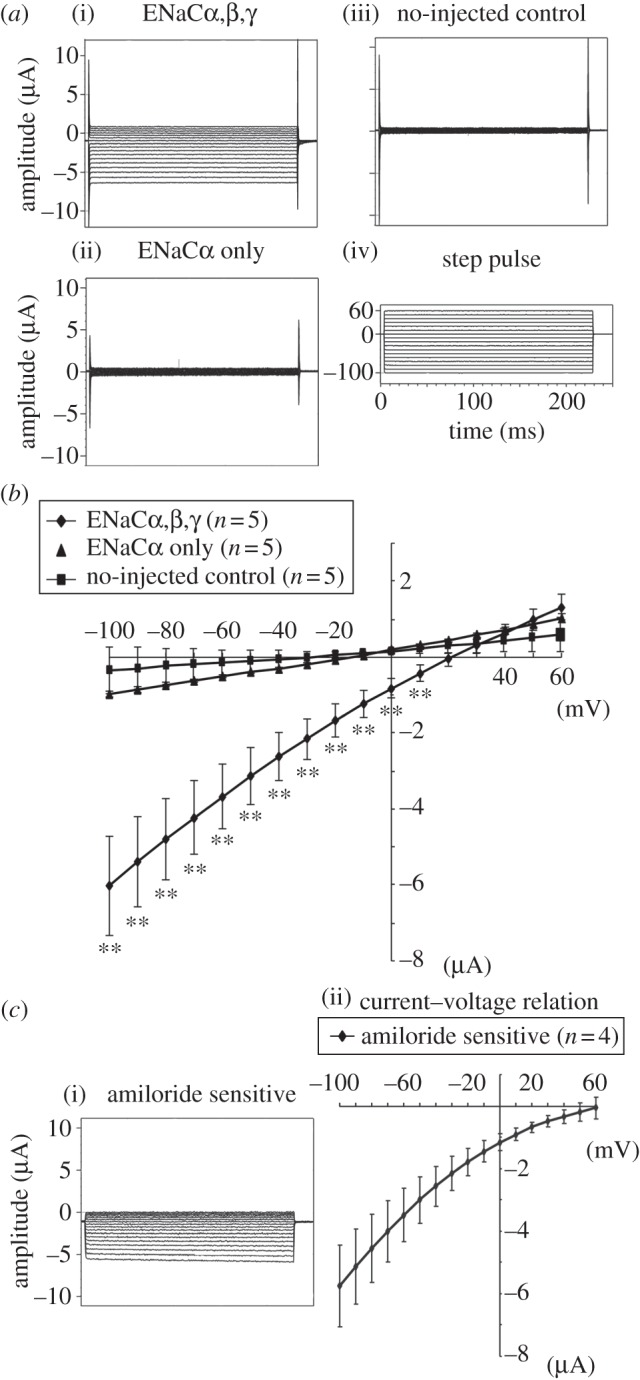
Figure 4.

Current recordings under a two-electrode voltage clamp for Xenopus oocytes expressing nENaCα and nENaCαβγ. (a) Representative traces were obtained from an nENaCαβγ-expressing oocyte (i: ENaCαβγ), and an oocyte-expressing nENaCα (ii: nENaCα only) and a non-injected oocyte (iii: non-injected control). (iv) Step pulse. Oocytes were voltage-clamped at 0 mV and step pulses were given from −100 to +60 mV in increments of 10 mV. (b) Current–voltage relationships for oocytes expressing nENaCα only and nENaCαβγ, and no-injected oocytes were shown. Results from five oocytes in each group were summarised. There were no significant differences in current values for ENaCα-expressing oocytes compared with the values for non-injected controls. There were significant inwardly rectifying currents in nENaCαβγ-expressing oocytes compared with the non-injected control oocytes. (c) Subtracted current before and after application of 10 µM amiloride from the same oocyte-expressing nENaCαβγ. Average of current–voltage relationship is shown in the right-hand side of the figure. Plotted data are shown as mean ± s.e. **p < 0.01 different from control.
