
Figure 1.
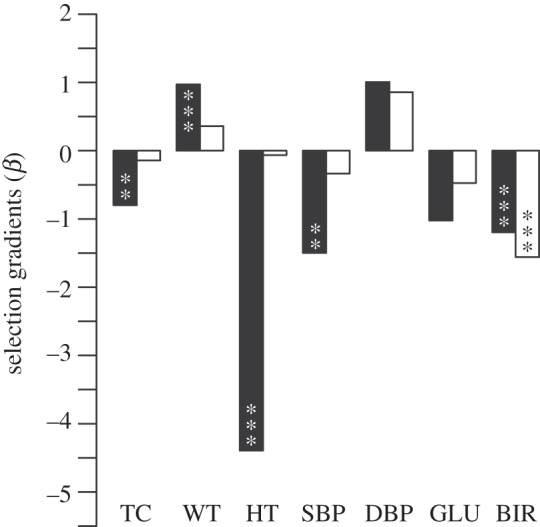
Magnitude and direction of linear selection gradients (β, unstandardized) acting on males (open bars, n = 2655) and females (filled bars, n = 2226) born between 1892 and 1956. Full results are in the electronic supplementary material, tables S1 and S2. TC, total cholesterol; WT, weight; HT, height; SBP/DBP, systolic/diastolic blood pressure; GLU, blood glucose; BIR, age at first birth. p-values are from multiple Poisson regressions (*p < 0.05, **p < 0.01, ***p < 0.001). Overall R2 values were 0.152 and 0.088 for male and female regressions, respectively.