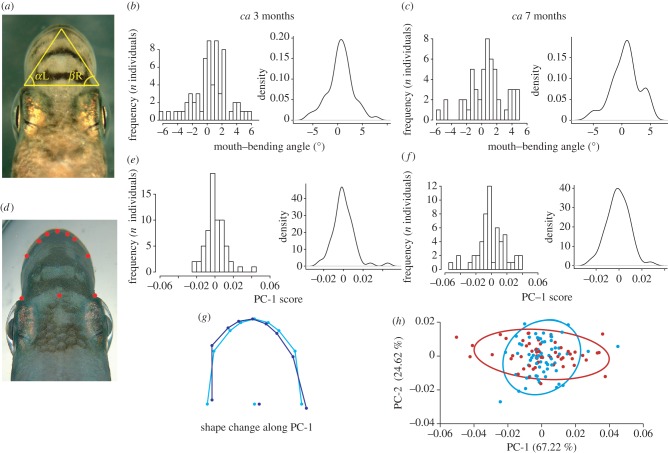
Figure 4.
Frequency distribution of traits related to mouth asymmetry in laboratory-reared juvenile P. microlepis. (a) The triangle indicates connection lines between the frontal points of the two eye sockets and the upper-jaw intersection, drawn to calculate angle differences between α L (angle of the vertex by the left eye) and β R (angle of the vertex by the right eye) on a juvenile P. microlepis [15]. Histograms and density plots of mouth-bending angles of (b) 3- and (c) 7-month-old fish. (d) A juvenile P. microlepis displaying the landmark set that was used for geometric morphometric analyses (see the electronic supplementary material, S1 for detailed description of how the landmark set was defined). Histograms and density plots of individual PC-1 scores for (e) 3- and (f) 7-month-old fish. (g) Shape changes that are associated with PC-1. Lines drawn in light blue represent an average consensus mouth shape, whereas dark blue lines indicate the shift in mouth shape that is associated with 0.1 units in the positive direction on PC-1 in (h). (h) The plot of PC-1 versus PC-2 displays the difference in variance along PC-1 between both age groups. Individual scores and 95% CIs indicated in blue and red for 3- and 7-month-old fish, respectively.

