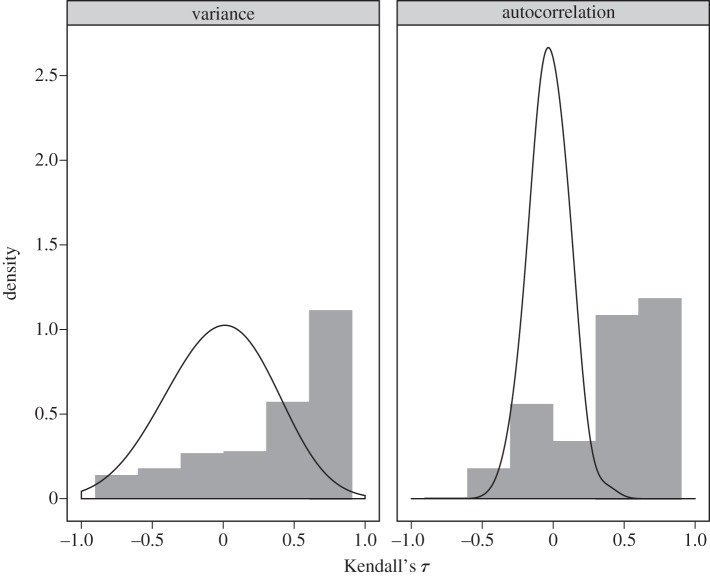
Figure 2.
The distribution of the correlation statistic τ for two early warning indicators (variance, autocorrelation) on replicates conditionally selected for having collapsed by chance in simulations is shown in grey bars. Solid lines indicate the estimated density of the statistic from a random sample of the simulations (not conditional on observing a transition). Positive values of τ correspond to a pattern of an indicator increasing with time; typically taken as evidence that a system is approaching a critical transition. In these simulations, the pattern arises instead from the prosecutor's fallacy of conditional selection.

