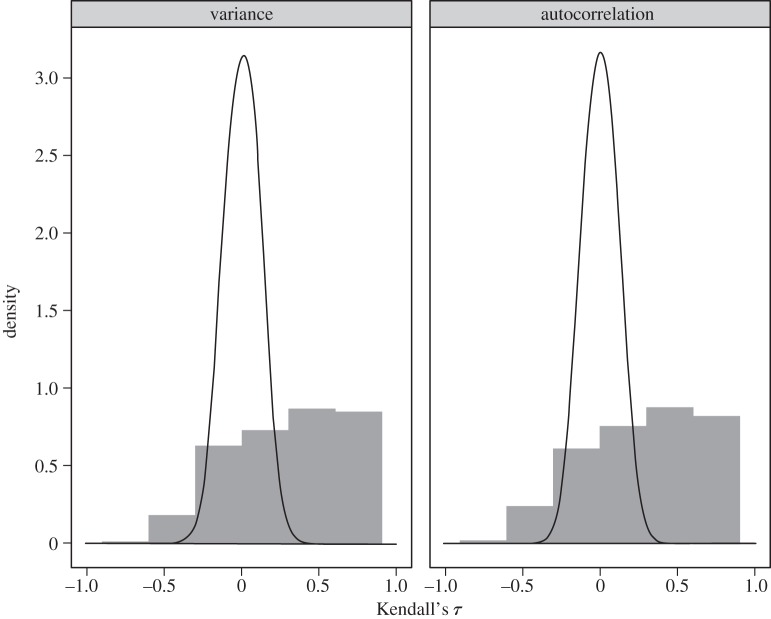
Figure 3.
The identical analysis from figure 2 is shown for the model in equation (2.3), using parameters r = 0.75, K = 10, a = 1.7, Q = 3 and H = 1. A similar statistical bias, particularly towards positive values of τ, occurs in this model as well.

