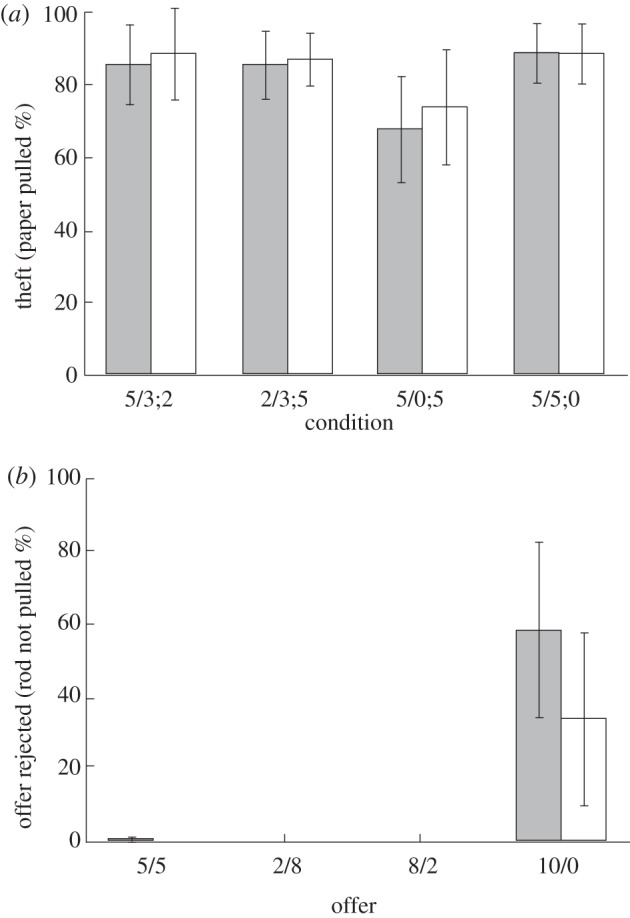
Figure 2.

Mean percentage of trials (± 95% CI) in which (a) proposers pulled the paper in the four conditions (games) of the test (grey bars) and the non-social control (white bars) conditions and (b) responders rejected offers by failing to pull the rod for the different possible outcomes in the test and non-social control.
