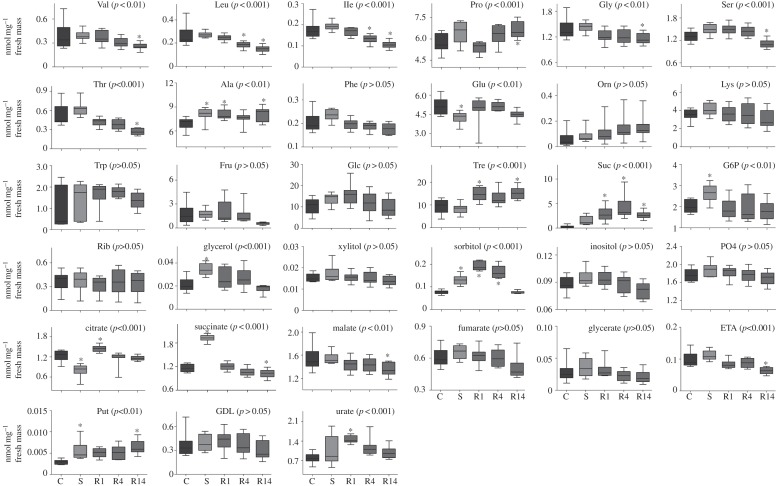
Figure 2.
Box plots illustrating treatment and temporal variations of all individual metabolites detected in the D. melanogaster metabolome. A box consists of upper and lower hinges and a centre line corresponding to the 25th percentile, the 75th percentile and the median, respectively. Data are based on 10 replicates (n = 10). Control flies (C), CO2-stressed flies (S) and recovering flies assessed 1, 4 and 14 h following CO2 treatment (R1, R4 and R14). For each compound, statistical outcome is summarized within the figure (ANOVA1: p-value) and symbols (asterisks) indicate when a mean was significantly different from control (Dunnett's test). Bonferroni's correction for multiple comparisons was applied.

