Figure 3.

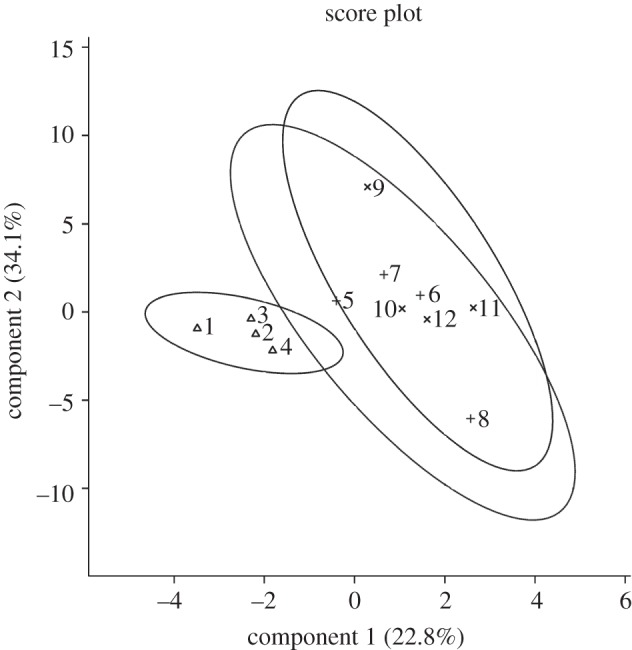
Projection of samples onto the first discriminant plane of the LDA. Control flies (C0, symbol Delta) and recovering flies assessed 24 and 48 h following CO2 treatment (R24, symbol ‘plus’ and R48, symbol ‘multiplication’; n = 4).

Projection of samples onto the first discriminant plane of the LDA. Control flies (C0, symbol Delta) and recovering flies assessed 24 and 48 h following CO2 treatment (R24, symbol ‘plus’ and R48, symbol ‘multiplication’; n = 4).