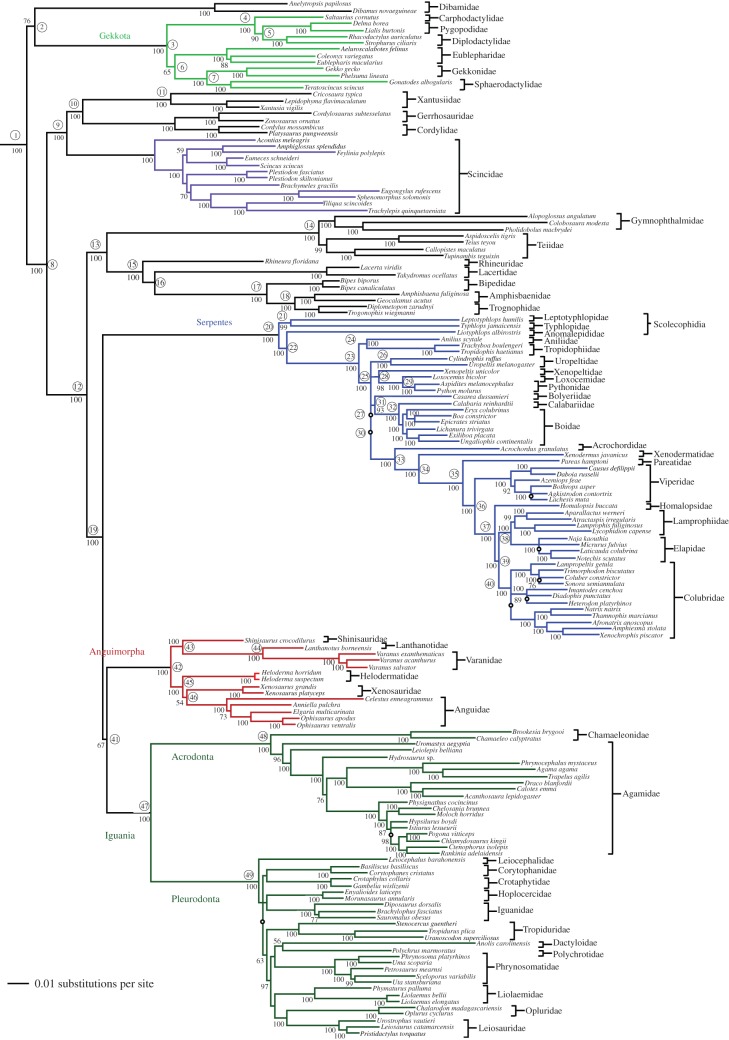
Figure 1.
Phylogeny of squamate reptiles from concatenated likelihood analysis of 44 nuclear genes (see the electronic supplementary material, figure S1 for Bayesian tree). Uncircled numbers at nodes indicate bootstrap values >50% (branches too short to depict here have clades indicated with an open circle); circled numbers correspond to clades in electronic supplementary material, appendix S5. Branch lengths are estimated by likelihood (length for root arbitrarily shortened to facilitate showing ingroup branch lengths).

