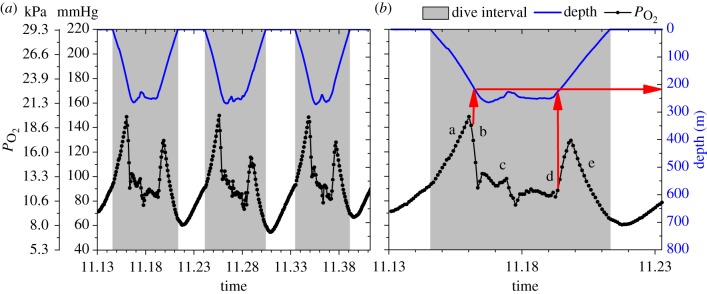
Figure 1.
Arterial  (black line, 5 s sampling interval) and depth profiles (blue line, 1 s sampling interval) from serial deep dives of a California sea lion. (a) Characteristic
  profiles of serial deep dives. (b) Typical abrupt changes in
  occur in this dive at approximately 200 m depth during descent and ascent (indicated with red arrows), consistent with significant cessation of gas exchange at depth. Profiles were characterized by a, an initial compression hyperoxia; b, an abrupt decline at approximately 200 m depth; c, a gradual decline in
  in the bottom segment of the dive; d, a rapid increase in
  during early ascent; e, a decline in
  during ascent.

