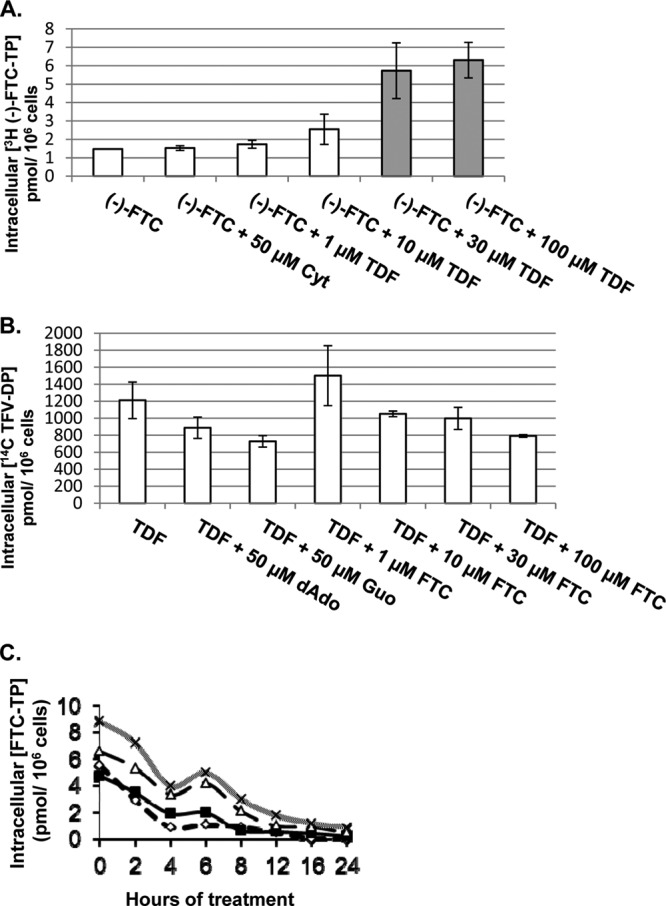
Fig 1.

Drug-drug interaction assay. (A) Effect of TDF on intracellular levels of (−)-FTC-TP. HepG2 cells were treated with 10 μM (−)-FTC alone or in combination with controls (2′-deoxycytidine or cytidine) and various concentrations of TDF for 4 h. Gray bars, a significant increase in intracellular concentrations. (B) Effect of (−)-FTC on intracellular levels of TFV-DP. HepG2 cells were treated with 10 μM TDF alone or in combination with controls (2′-deoxyadenosine [dAdo] or guanosine [Guo]) and various concentrations of (−)-FTC for 4 h. (C) HepG2 cells were treated with 10 μM (−)-FTC alone (◊) or in combination with 1 μM TDF (■), 10 μM TDF (△), or 30 μM TDF (×) over 24 h in a decay study. Drugs were tested singly in triplicate, and each data point represents the mean value with a standard deviation of ≤20%. All concentrations shown are in μM. For the Student t test, two samples assuming equal variance were used to determine a P value of <0.05.
