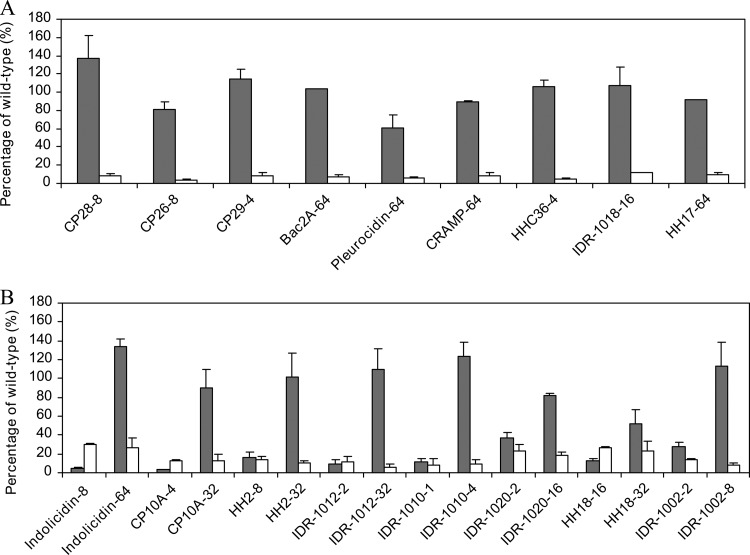
Fig 4.
Induction of the arn operon by different peptides. Percentage of induction displayed by the parR and the cprR mutants compared to the wild type in the presence of different peptides that triggered responses similar to those of CP28 (A) or indolicidin (B). The gray and white bars represent the parR and the cprR mutants, respectively. The labels on the x axis show the name and concentration of each peptide in μg/ml used to obtain the values shown. The values correspond to the averages and standard deviations of three independent experiments.

