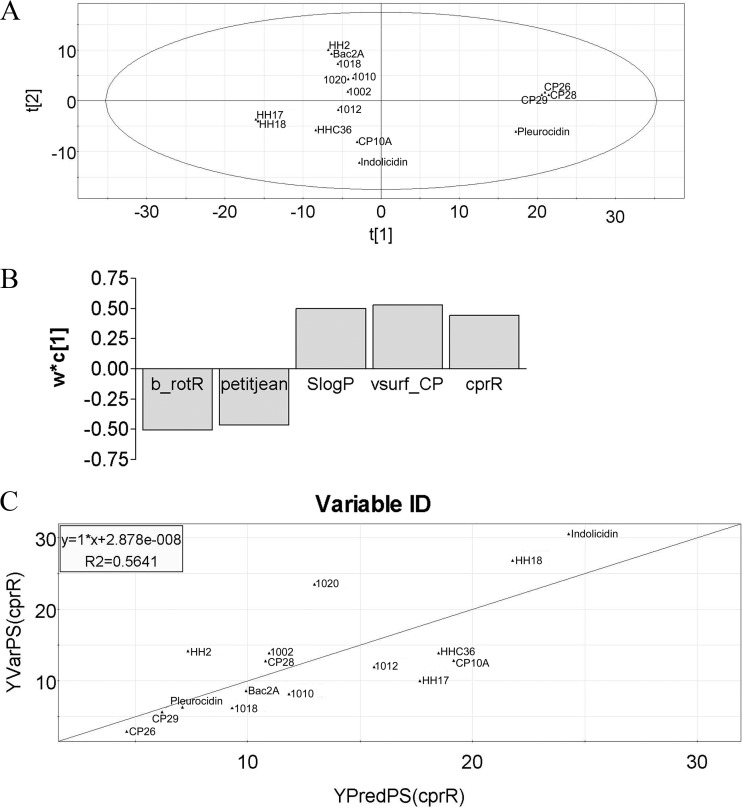
Fig 5.
PCA and PLS modeling of arn induction in the cprR mutant. (A) First two components from the principal component analysis of the optimized peptide set. t[1] and t[2] stand for the scores for principal components 1 and 2, respectively. (B) Loadings of the first components from the PLS analysis of the optimized peptide set. b_rotR and petitjean are negatively correlated, while SlogP and vsurf_CP are positively correlated with the levels of arn induction in the cprR mutant. w*c[1] stands for weight of variables. (C) Predicted versus observed peptide induction of the arn operon in the cprR mutant using the 4 selected descriptors.

