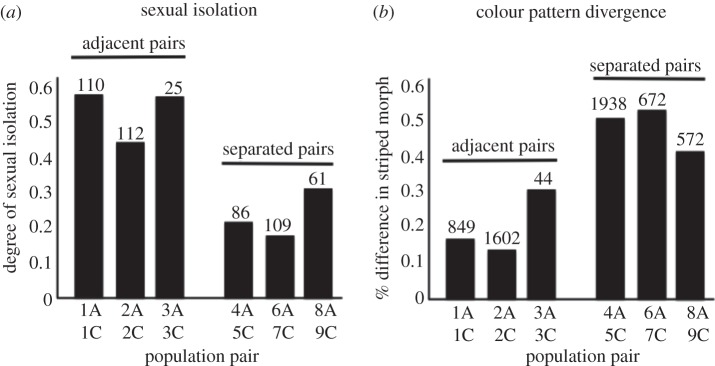
Figure 1.
Evolutionary divergence between geographically adjacent versus geographically separated population pairs of Timema cristinae. Codes on the x-axis label the population pairs (A refers to use of Adenostoma as a host and C to use of Ceanothus). (a) Sexual isolation is stronger between adjacent versus separated populations (p < 0.01), indicative of reinforcement. Numbers above bars represent number of mating pairs tested. (b) Divergence in cryptic coloration is weaker between adjacent versus separated populations (p < 0.05), indicative of homogenizing gene flow. Numbers above bars represent number of individuals scored for the presence versus absence of a dorsal stripe.

