
Figure 1.
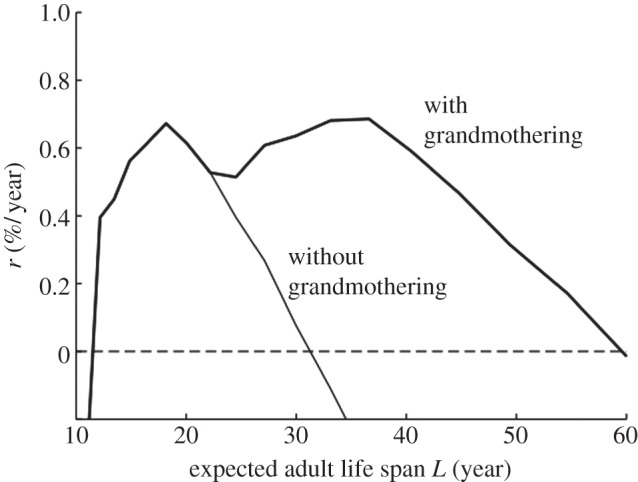
Female reproductive output as a function of expected adult life span. Plots of net growth rate, r, versus expected adult life span, L, for populations with and without grandmothering. (In this simulation, the time step, Δt, was taken to be 1/12 years to generate a smoother plot. Such a small time step proved to be too computationally demanding for other simulations.)