
Figure 3.
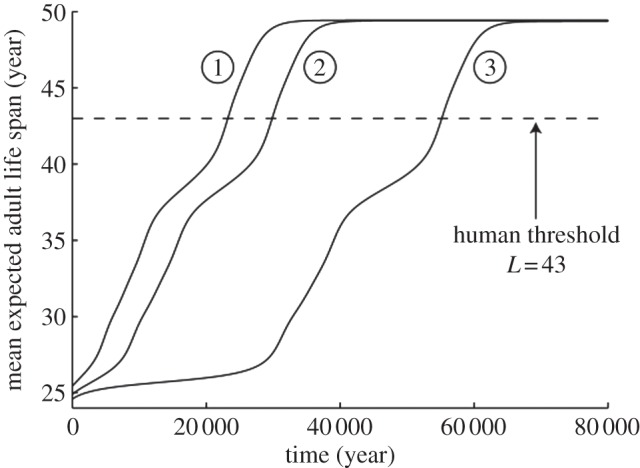
Evolution of populations from lower to higher expected adult life spans in the presence of grandmothering. The starting points (1) 25.4, (2) 24.9 and (3) 24.6 years correspond to equilibria without grandmothering of the three male trade-off curves in figure 2. Mean expected adult life spans over the population converge to (1) 49.43, (2) 49.40 and (3) 49.37 years in the presence of grandmothering. The population crosses the human threshold of L = 43 within (1) 24 000, (2) 30 000 and (3) 56 000 years.