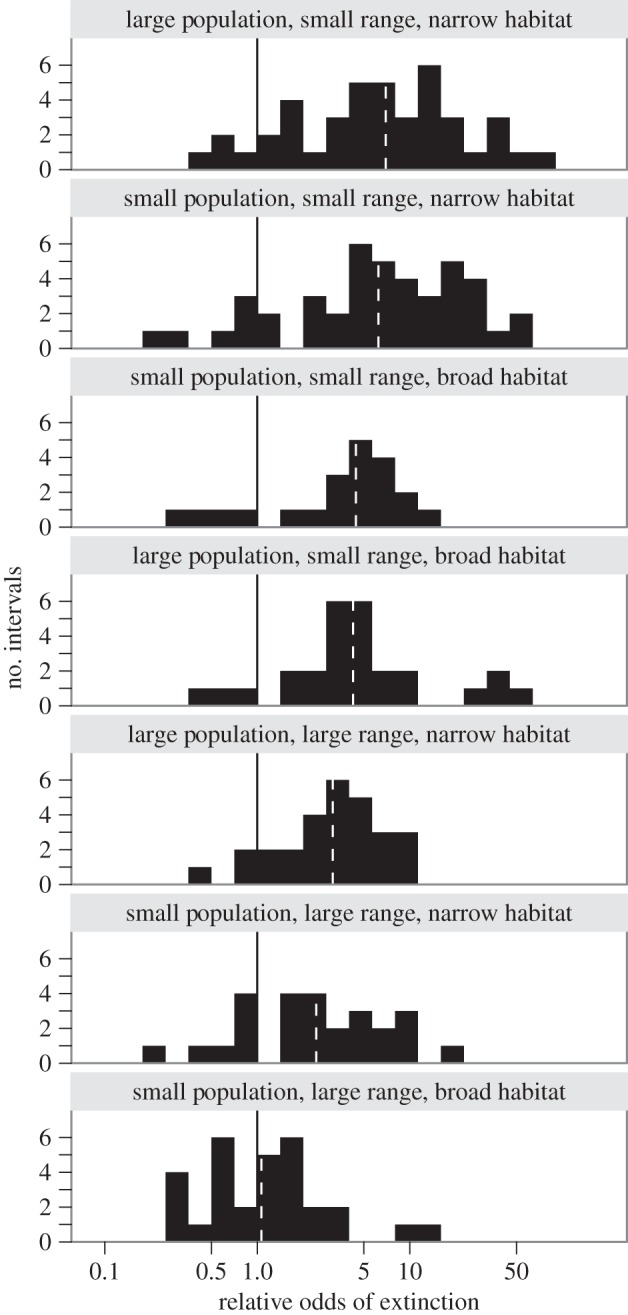
Figure 2.

The relative odds of extinction for the seven forms of rarity over the last 500 million years, with risk increasing from the bottom to top panels. Data are from figure 1, and are the number of time intervals characterized by different odds of extinction for genera in each rarity class relative to common genera. The solid black lines denote equal odds of extinction between rare and common genera. Dashed white lines denote the median relative odds of extinction for each rarity class over the last 500 million years. At the greatest risk of extinction are genera with both small ranges and narrow habitat breadth. Broader habitat breadth helps buffer narrowly distributed genera from extinction, whereas variation in the population size has negligible effect.
