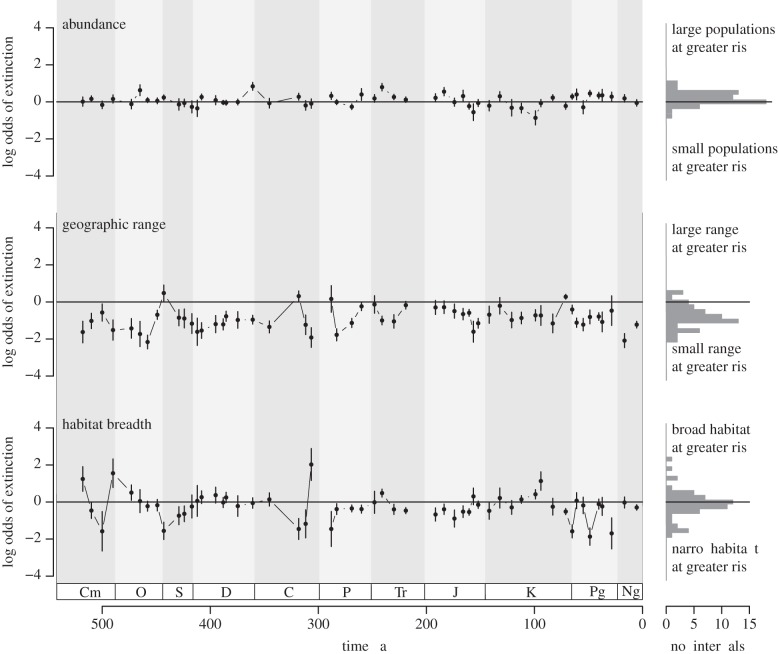
Figure 3.
The relationships between extinction risk and abundance, geographic range and habitat breadth over the last 500 million years estimated using a multiple logistic regression model containing the three continuous predictor variables. The solid line indicates no association between the predictor variable and extinction risk. Negative values indicate an inverse association between the predictor and extinction risk. Histograms for each aspect of rarity present the number of time intervals characterized by different log odds of extinction. The associations between each aspect of rarity and extinction risk in this continuous analysis are comparable with those observed in the analysis of discrete rarity classes.

