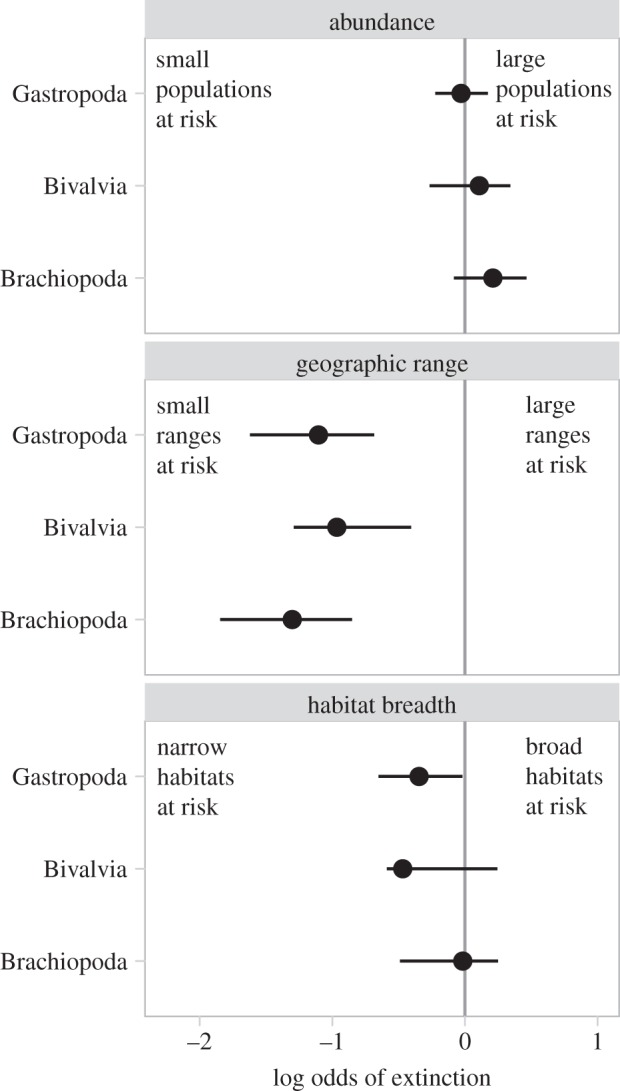
Figure 4.

The log odds of extinction for gastropod, bivalve and brachiopod genera over geologic time according to their abundance, geographic range and habitat breadth. Values are the median (circles) and interquartile range of log odds values for geological stages, generated by fitting a continuous multiple logistic regression model separately to data for each clade in stages for which more than 50 genera in the clade have associated rarity data. The solid vertical line indicates no association between the predictor variable and extinction risk. Each group shows selectivity patterns consistent with the pooled analysis and there are no significant differences between clades in their distributions of log odds values for each predictor variable.
