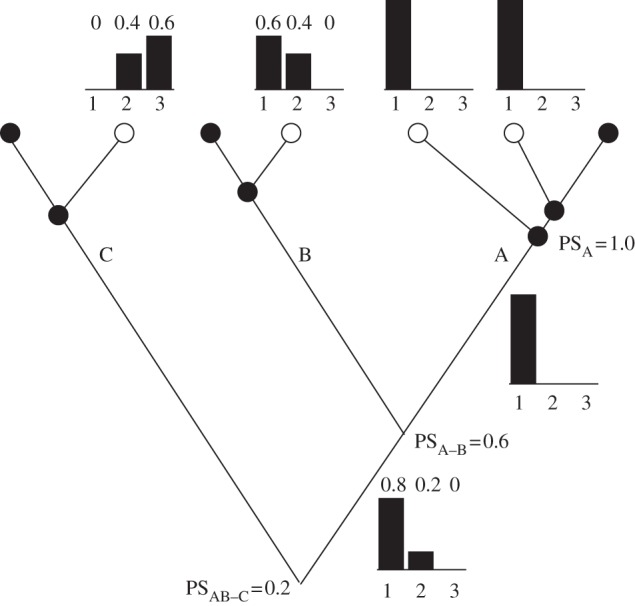
Figure 1.

Hypothetical example to illustrate calculation of proportional similarity (PS) to measure probability of gene reuse between sister taxa. A, B, and C represent species having one or more populations that independently evolved a similar change in phenotype (open circles) compared with an ancestral phenotype (filled circles). Bar graph above each derived population indicates the relative contributions of each gene i to the phenotype (here, i is 1, 2 or 3). PS is calculated between a pair of taxa as PS = Σi min(pi1, pi2), where pi1 and pi2 are the proportional contributions of gene i in the two taxa. Within a species, PS is measured between all pairs of derived populations and averaged. Relative contributions of genes are then averaged among populations (illustrated for species A by the bar graph immediately below node A). PSA–B compares the relative contributions of the three genes in species B with the average for species A (PS = 0.6 + 0 + 0 = 0.6). PSAB-C compares the relative contributions of the three genes in species C with the average of A and B, shown in the bar graph below the node connecting A and B (PS = 0 + 0.2 + 0 = 0.2).
