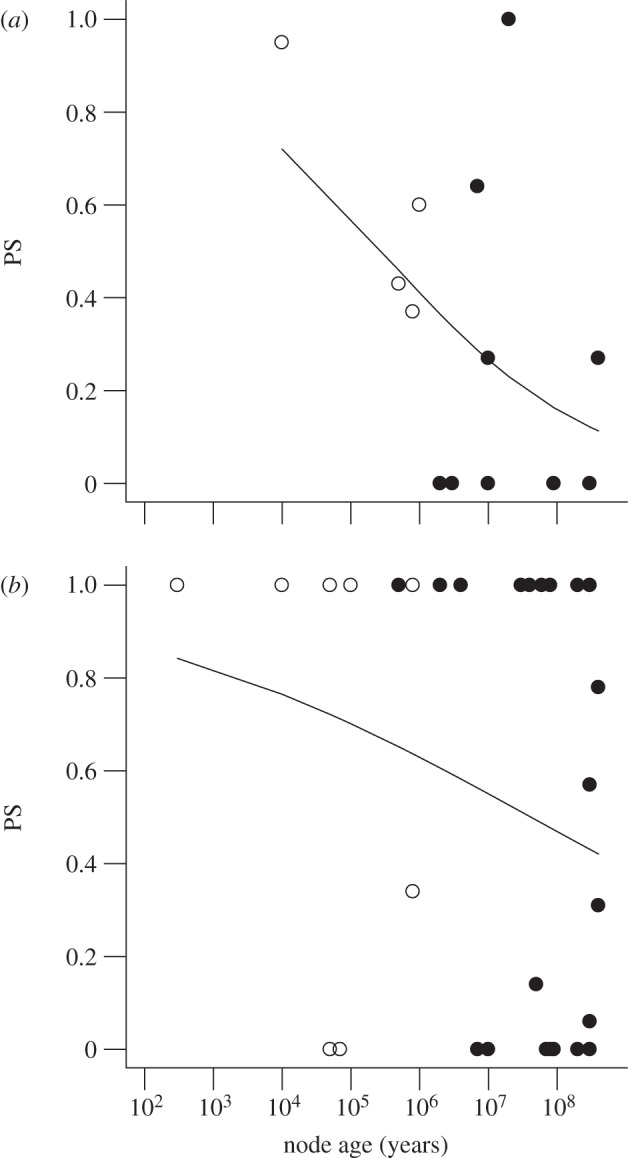
Figure 2.

Measurements of the probability of gene reuse based on (a) data from genetic crosses and (b) candidate gene data. Open symbols represent average of PS between all pairs of derived populations within the same species (i.e. parallel evolution). Filled symbols represent similarity measurements between sister taxa at deeper nodes in the phylogenetic trees (i.e. convergent evolution). Curves are best-fit logistic regressions to the data.
