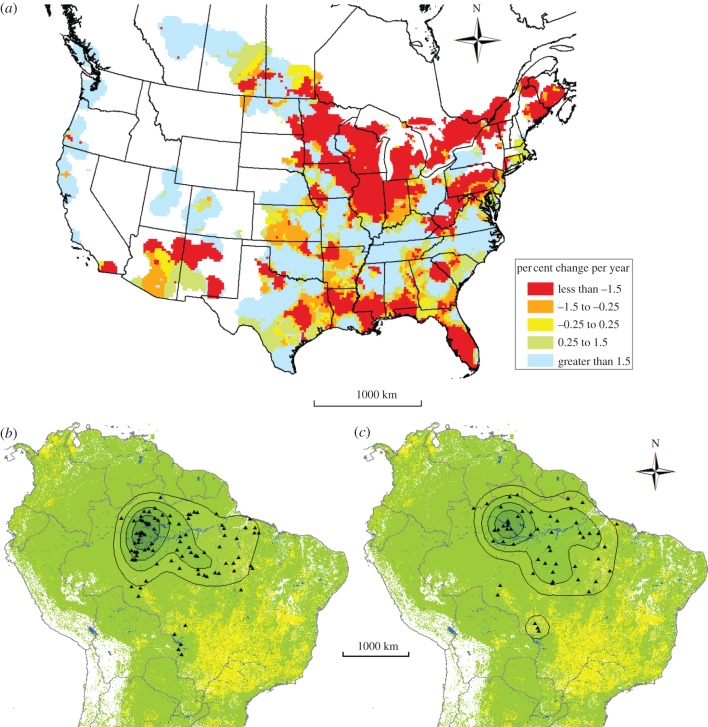
Figure 2.
(a) Population trends based on the BBS data (1966–2010). Kernel density of all winter roost locations occupied for ≥30 days by martins (P. s. subis) from (b) northern breeding populations (Minnesota, South Dakota, Pennsylvania, New Jersey; n = 59 individuals, 97 roosts) and (c) central/southern breeding populations (Oklahoma, Texas, Virginia; n = 30 individuals, 55 roosts). Maps show kernels of 20, 40, 60 and 80% of the total density. Green shading represents forest and non-agricultural vegetated cover; yellow shading represents agricultural lands.

