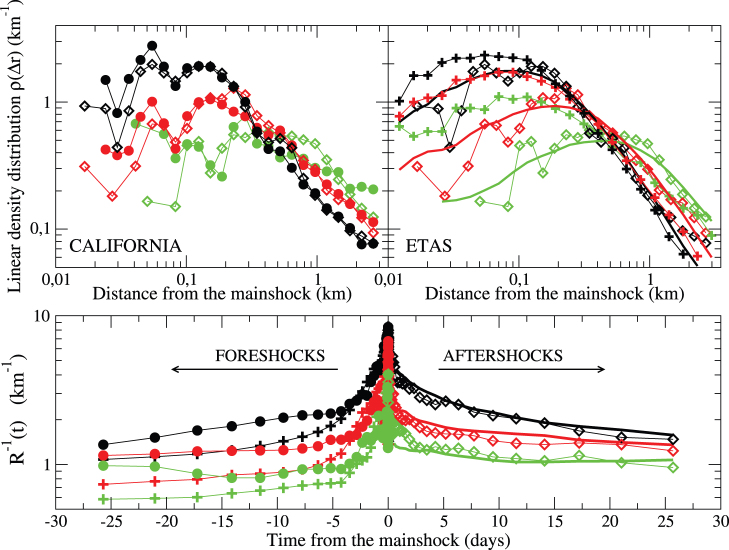
Figure 1. Aftershocks and foreshocks spatio-temporal organization in Southern California.
Left upper panel. The linear density probability ρ(Δr) for foreshocks (filled circles) and aftershocks (empty diamonds) are obtained considering all events occurring within 12 hours from the mainshock. Different colors correspond to mainshocks in different magnitude classes, m ∈ [M, M + 1), and M = 2, 3, 4 for black, red and green symbols respectively. We restrict the distribution to Δr ≤ 3 km in order to reduce the contribution from background seismicity. Right upper panel The linear density probability ρ(Δr) averaged over 50 independent realizations of synthetic catalogs generated by the ETAS model. Details on the numerical procedure are given in the Methods. Data for aftershocks and foreshocks in numerical catalogs are indicated as continuous lines and pluses, respectively. Open diamonds refer to the aftershock ρ(Δr) in the experimental catalog. Black, red and green colors correspond to M = 2, 3, 4 respectively. Lower Panel. The inverse average distance  is plotted as function of time from the mainshock. Here ρ(Δr, t) is the linear density probability in the interval [–1.2t, –t] ([t, 1.2t]) before (after) mainshocks for foreshocks (filled circles) and aftershocks (empty diamonds), respectively. We average 1/Δr, instead of Δr, in order to reduce the influence of background seismicity and, for the same reason, we fix Rmax = 3 km. The same symbols as in upper panels are used.

