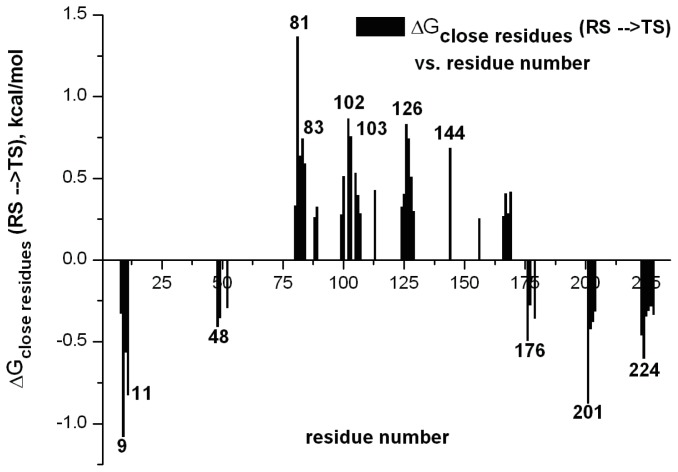
Figure 10.
Predicting mutation hotpots for a designed Kemp eliminase. The y-axis denotes the interactions (in kcal/mol) between the protein residues with the substrate as its charge changes upon moving from the reactant state (RS) to the transition state (TS). Large negative contributions suggest optimal sites for mutations likely to enhance the catalytic effect. This figure was originally presented in [36].

